Saturday, October 29, 2016

Corn in the backyard, 2016 -- weeks 19, 20, 21 and harvest!

September 4

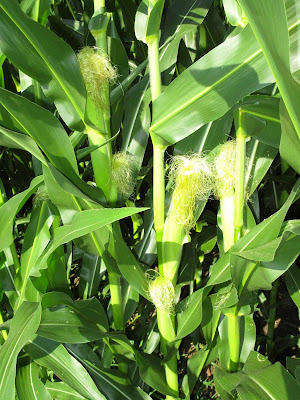
At the end of week 19, the ear husks had dried completely aided by temperatures producing about 7% more growing degree days than normal, and despite about an inch of rain.  Conveniently, the husks peeled back to reveal an earful of beautiful kernels.  The stalks and leaves were still mostly green, but progressively drier each week.

September 11

The week leading up to September 11 brought almost 3 inches of rain over four days and 28% more growing degree days than average.  It was hard to spot any differences in the kernels, but the stalks and leaves continued to show further drying.

September 18

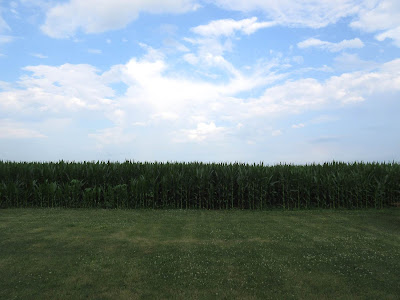
Several of the neighbors had harvested already by September 18, while the field behind our house seemed to accelerate in its rate of drying.  More temperatures above normal probably helped the drying, while occasional thunderstorms made the fields too wet to harvest every day.

On September 22, Farmer Wagenbach started attacking the field with the combine in the late afternoon, and kept harvesting until well after dark.  Consequently, we couldn't get a shot of the fully harvested field in the daylight until the next day, hence the next photo taken on the afternoon of the 23rd.

September 23

Finally, a somewhat artsy shot of the combine and grain wagon working their way west after sunset. We haven't heard the yield numbers yet, but the vast majority of the field looked pretty good, so I'd be surprised if the yield wasn't at least satisfactory. The stalks and leaves left in the field have since been baled and hauled away, but the field has not been tilled yet to prepare it for winter. Next spring seems a long way off, but we'll be ready again then to watch the wonder of plant growth in our backyard.

Thursday, September 29, 2016

Finding Familiarity in Massachusetts

For some of my readers, this isn't a big deal, but since I have a slightly uncommon surname, it's kind of a big deal when I find my name somewhere I don't expect.

Our trip to Massachusetts last spring took us within a few miles of the street sign pictured above, so I considered it worth the effort to stop for a photo-op. Electronic mapping applications revealed this road that likely would have escaped us if our only navigational aid was a paper map.

I've seen roads named after important historical figures, or prominent personalities in a community, or simply named after one resident that happened to live on that road. I haven't yet discovered why the community of Fall River, Massachusetts chose this name for this road, but I haven't given up the investigation either. If any readers can share any insight, please comment below and I'll be in your debt!

Thursday, September 1, 2016

Corn in the backyard, 2016 -- weeks 14, 15, 16, 17, & 18

July 31

The last week in July brought 15% more growing degree days than normal, and more than two inches of rain, so the plants should have had more than enough resources to continue the ear development. That development appeared to be continuing, and stalk drying was not widely evident.

August 7

By August 7, the ears appeared to be full size and what kernels were visible appeared to be fully formed. Growing degree days totaled about 10% more than the historical average, but evidence of stalk drying was practically non-existent. Rainfall was minimal, but humidity remained high.

August 14

In week 16, the ear husks showed more drying, and the bottom leaves of some stalks showed evidence of drying as well, while higher temperatures resulted in 19% more growing degree days than normal. One thunderstorm produced more rain than typical, and humidity remained high most of the week.

August 21

The week ending August 21 brought a few brief thunderstorms, generally high humidity, and about 10% more growing degree days than average. Leaf drying on the stalks was much more evident, and ear husks also continued drying.

August 28

A few days before these pictures were taken on August 28, a portion of the field was harvested for silage (similar to last year), but obviously the corn immediately behind our house was left for grain harvesting later in the year. As you can tell from the photos, stalk and leaf drying continued to accelerate driven by temperatures that were near normal, and light total rainfall.

Saturday, July 30, 2016

Corn in the backyard, 2016 -- weeks 11, 12, & 13

July 10

Week 11 brought slightly cooler temperatures (about 10 percent below the historical average), adequate rainfall, and no unusual incidents. As a consequence, the ears continued to develop nicely and the plants were well into the process of pollination. The overall height of the plants climbed a few more inches to 112.

July 17

Since the silks were considerably more brown than the week before, we know the pollination period was finished and that kernels were developing on the ears by July 17. Temperatures were near normal (about 3 percent above the historical average), and rainfall was pleasantly consistent. I'd noticed about this time that it had been several weeks since we had received an extended rain shower, as all of our rain had come in thunderstorms. Nonetheless, it's been sufficient to keep all our plants and aquifers well supplied. The corn height plateaued at 112 inches as the plants concentrate their energy on ear development.

July 24

I don't think it's evident in any of these photos, but I noticed Japanese beetles congregated on several ears where the silk enters the husk. Fortunately, they appeared to be attracted after the silks turned brown, but their presence surprised me since I'd never noticed them attracted to ears of corn before. The week preceding July 24 experienced more growing degree days than average on each of the seven days. In total there were 17% more growing degree days than the historical average, and thunderstorms continued to provide adequate rainfall. We should begin to see stalk drying near the ground soon since we're well over halfway to harvest.

Tuesday, July 26, 2016

Images from Europe: Aare River Valley, Switzerland


If you could live anywhere you wanted, where would it be? A tropical beach? A metropolitan skyscraper? A snowy mountainside? A Mediterranean cliff? While our visit to Gimmelwald, Switzerland last September introduced us to some breathtaking scenery, the Aare River Valley probably more closely fits my idea of an ideal domicile: more easily navigated than the High Alps; forested, but not too heavily; mountainous without feeling claustrophobic or acrophobic; and as you can tell in the photo, scenic even on a cloudy day. I love my surroundings in Central Illinois, but this region definitely gives my home a run for its money.

Our primary reason for visiting this region was to view Reichenbach Falls, probably best known as the location of Sherlock Holmes' last battle with Professor Moriarty in Sir Arthur Conan Doyle's "The Final Problem." The Reichenbachfall funicular carries passengers 800 feet up the mountainside to a viewing station that offers a classic view of the full height of the section that impressed Conan Doyle enough to include it in his story. That's not the only view from that station, however.

If you turn from your view of the falls and look toward the northeast you'll see the pleasant valley pictured above. Rain had fallen just before we arrived, leaving low clouds and the misty atmosphere that gives this photo some of its charm, however, I suspect the valley may be equally charming in full sunlight. I think I could be content living in this quaint valley for the rest of my life.

As a tourist attraction goes, I recommend this area for the trip (train or hike) to the Upper Reichenbach Falls and the delightful views of the valley from the mountainside. Although we didn't see nearby Aare Gorge while we were there, we understand it is very scenic and offers unique hiking opportunities via walkways over the river. Should we return to this part of Switzerland again in the future, I would like to include more time in the itinerary to explore this area more fully. Anyone care to join us?

Monday, July 11, 2016

Corn in the backyard, 2016 -- weeks 9 & 10

June 26

The week leading up to June 26 produced the largest weekly growth this year as the plants leaped to 84 inches in height blessed by 1.6 inches of rain one day that week, and 23% more growing degree days than average. At that point, there was no evidence of tassels or ears on the stalks I observed.

July 3

The long-awaited ears have appeared! Even though cooler weather resulted in 16% fewer growing degree days than is typical, the plants have continued to mature normally and reached 106 inches height to the tips of their tassels. An additional few tenths of an inch of rain helped insure against drought stress. Typically, the ear and its kernels is the primary feature of interest in corn plants, but since a portion of this year's crop will probably be harvested for silage like it was last year, the volume of stalk harvested is probably also important. We will continue to monitor both stalk growth and ear development as the season progresses so all our readers won't miss any exciting details!

Monday, July 4, 2016

Japanese Beetle Trap, Part 2

"The Japanese beetle is probably the most devastating pest of urban landscape plants in the eastern United States." Those words from two entomologists at the University of Kentucky aptly describe the impact of these pests that unfortunately have invaded our yard again this year.

About four years ago I described our initial battles with Japanese beetles, and showed a picture of the Spectracide bag system that we employed. After being emptied several times, and being subjected to the winds common in our yard, that bag ripped beyond repair and forced me into a different alternative. I was pleased with the success of the lure and trap idea, but modified the concept as shown below.

The lure is still the Spectracide Bag-A-Bug Japanese Beetle Trap2 Lure which you can see suspended by a 12 gauge insulated wire above the red funnel. The bag has been replaced by a 5-gallon bucket which contains about a gallon of soapy water. This allows me to avoid the steps of dumping the bag into a bucket of water and waiting for the bugs to suffocate. Every day or so I empty the bucket and refill it with soapy water and wait for more beetles to enter and die. Hundreds of beetles accept my invitation each day and enter the bucket to take a swim.

The bucket lid has a 3.5" diameter hole cut in the top and the funnel is simply caulked in place. The funnel end was trimmed back so the smallest portion of the funnel is about 1" in diameter to allow the beetles to more easily enter the bucket. After four years of use I replaced the lid this year as the original Menards lid became brittle and unusable after many hours of exposure to the sun. The bucket itself also cracked at the mounting hole of the handle, but I was able to relocate the handle to a different location so I hope to get more seasons of use from this bucket.

The big question is: does this type of trap attract more beetles than it kills? A quick search around the internet (and reading the article from the Kentucky entomologists quoted above) will show that there are plenty of folks that think these traps are a waste of money and worse for your plants than if you didn't have a trap at all. Spectracide recommends placing your trap 30 feet downwind from the plant of interest, but because our wind comes from lots of different directions, and we have four different plants that attract the beetles, a perfect location on our property would be hard to identify. The image above shows the trap location that has served us well for the last four years. As you can see, none of our plants is less than 30 feet from the lure, and most don't even have a line of sight to the lure. Whether that makes the trap more or less effective, I can't say.

What I can say: the damage due to Japanese beetles on our property is severely reduced by the presence of our trap. Does the lure attract beetles from neighboring properties? Maybe, but if our plants have less damage, I don't really care whose beetles I'm killing. Are there more beetles attacking our plants because I have a lure in my yard? Judging by the damage to the plants, I would conclude that fewer beetles attack our plants since we have less damage when the trap is active.

Tips for best success with a beetle trap
1. Set the trap out early in the season. By the middle of June here in Central Illinois the beetles' damage can be visible from a distance. In my experience, luring the beetles before they can cause extensive damage will reduce the total amount of damage done.
2. Pick beetles off of plants by hand. If you find beetles on your plants, you can easily remove them by grabbing them and tossing them into a bucket of soapy water. I carry my lure bucket to the raspberry plants and hops and have it close by when I physically remove as many bugs as I can. This is easiest to do in the morning or evening as the beetle are much more lethargic and typically don't try to fly away when you grab them. If you find grabbing them unpleasant, you can position your soapy water beneath the branch and shake them into the container. With taller plants like our cherry tree, I simply try to shake the branches to cause the beetles to fly away or drop to the ground. Either way, they're likely to smell the lure and be more attracted to my trap than the tree. The maple tree is too tall, so I make no attempt to remove the beetles from that tree.
3. Remove as many beetles as possible. Several sources indicate these beetles can smell a plant that is being eaten by another beetle, so it's common to see beetles swarm a plant and ignore its neighbor. I have found that if I can remove all the beetles from a plant the beetles are much less likely to come back to that plant. Repeating the process over several days can leave a plant beetle-free for the rest of the summer even though it had been a favorite days before.

I don't have scientific test results that prove our trap is beneficial, rather only my observations. I've seen the damage that beetles can do when left unchecked, and I remember wondering if our cherry tree was going to survive their attack. Since employing our lure bucket, the only time we've had noticeable damage was when I was late setting the trap out and the beetles got a head start on me. I don't have experience dealing with the beetles in the larva stage (other than killing the ones I find when digging in the yard), but I do know the adult beetles can be controlled significantly with a lure trap like mine.

Thursday, June 23, 2016

Corn in the backyard, 2016 -- weeks 6, 7, & 8

June 5

The week before June 5th was warmer each day than the historical average, accumulating 34% more heating degree days than normal. The plants cooperated by leaping up to 24 inches tall on average, which is about average for this time of year, and consistent with 2010 when the planting date was about the same as this year.

You may have heard the phrase, "knee-high by the Fourth of July" when referring to corn growth. In our backyard, the knee-high phase is typically passed by the Fourth of June, as was the case this year. Here's photographic proof.

June 12

The week prior to June 12 saw five of the seven days average warmer temperatures than the historical average, but rainfall only managed a trace.  Heating degree days totaled 23% more than average and the corn plants continued to match historical norms by reaching 40 inches tall.

June 19

I wouldn't say the corn plants looked bad on June 19, but continued hot weather with minimal rain showed its effect on the grass in my yard, and the corn around it. You'll notice the leaves have a slightly spiky appearance that is the result of dry, hot weather as the plant attempts to conserve moisture. All seven days of the week were warmer than average, resulting in 31% more growing degree days than normal, while the plants continued to grow at a normal pace, reaching 57 inches tall.

The other item worthy of note is the fact that the farm across the highway is barely visible now, and the vehicles on the highway are fully hidden from view.

Monday, June 20, 2016

A Simple Family Tree

Is there any object in your house that makes you smile every time you look at it? Several years ago, Karen found this tree and we gathered photos, made copies in appropriate sizes, and populated the frames as you see in these two photos. Even though I've been looking at these photos almost every day for years now, I still find joy in the beauty and memories captured in this project.

Karen's side includes a darling picture of her as a preschooler at the top, and images of her parents immediately below revealing her mother as a huggable toddler, and her father sporting an impish grin that was probably well known to his parents. Karen's grandparents are on the next row down, both shown in their wedding photos. At the bottom, Karen's father's maternal grandparents are pictured in their engagement photo on the left while Karen's mother's paternal grandparents are shown in a semi-candid shot later in their marriage.

My side of the tree includes a shot of me as a preschooler at the top, and photos of my parents as teenagers just below mine. We included my mother's parents' engagement picture on the next row, along with the wedding picture of my father's parents. The bottom row has two candid shots, showing my mother's maternal grandparents on the left and my father's paternal grandparents on the right (an image that has graced this other post on this blog).

It's probably good that the tree doesn't have four frames on the bottom branches as I'm not aware of any photos of the great-grandparents that are missing from the tree now. I only have recollection of one of my great-grandparents, and since Karen and I both lost at least one grandparent before we were born there are plenty of people on this tree we've never met. Nonetheless, my heart is warmed by this reminder of the people that have made us who we are.

Wednesday, June 1, 2016

Corn in the backyard, 2016 -- weeks 4 & 5

May 22

The week leading up to May 22 was quite a bit colder than normal, and recorded a bit more than half the historical average for growing degree days. Consequently, the plants only grew a couple inches that week. Special thanks to my trusty assistant, Lily, for taking photos for me while I was out of town on the 22nd.

May 30

The next week turned warmer and provided decent rain such that the plants sprouted up to 15 inches tall while enjoying 49% more growing degree days than average. Like most years, it appears that the plants won't have any trouble reaching knee high by the fourth of June.

Wednesday, May 18, 2016

Does the Wind Affect MPG?

Cars today are so powerful that we rarely notice winds as we hurtle along at highway speeds, but believe it or not, your vehicle uses more fuel driving into the wind versus driving through calm air. Need proof? I believe the data below can prove it.

A Little Overview
Previously, I shared my evidence that air temperature affects fuel economy, and my evidence for wind speed comes from the same source. I've recorded the miles per gallon (MPG) I achieve on my commute to work each morning, and combined that data with wind speed measurements recorded by weather services reporting on the internet. Bear with me as I try to show the correlation I think is evident in the data.

The Simplified Analysis
This first chart compares the wind speed reported by a weather station in my area with the MPG recorded by my car. As you can see there's no real correlation between fuel economy and wind speed. What's missing is the direction of the wind relative to the car.

Intuitively, we expect a headwind to lower fuel economy while a tailwind should increase it. Without a directional component to the data, it appears to be random, and one might conclude that fuel economy is independent of wind speed.

Fortunately, the wind speed data sources used for this analysis include the direction of the wind. Given the wind speed and direction, the resultant direction of my commute based on the start and end points, and the average speed of the vehicle, we can calculate what I call the "Average Relative Headwind Speed." In simple terms it's the average speed of the air striking the car as it traveled over the entire commute, and combines the effect of the wind speed with the speed of the car.

This plot shows a stronger trend than the first plot, indicating that as relative headwind speeds decrease, fuel economy increases. You might also notice that it's difficult to represent the trend with one simple curve (shown here as a solid red curve). I believe that's because fuel economy is dependent on other factors besides wind speed, or temperature for that matter. In a future post, I'll try to combine all these factors in a way that better represents the connection between multiple weather conditions and fuel economy.

More Details on Assumptions, Methods, and Data
As I mentioned earlier, this data was gathered while commuting to work each morning in my 2013 Volkswagen Passat TDI SE which has a diesel engine and manual transmission. The MPG readings were provided by a dashboard monitor that computes average MPG over the course of a trip. I don't know how VW programs that calculation, but presumably it's a function of distance traveled and fuel flow to the engine.

The data presented here was gathered between February 9 and July 2, 2015 so that the date range matches my previous post, Does Outside Air Temperature Affect MPG? In that post, I noted that the route was consistent each morning until April 2, when road construction added a detour that included a longer 45 mph zone each day until the end of the data period. I've continued gathering data since then, so more data is available and will likely be shared in the future. As traffic and road conditions allowed, I attempted to maintain the same speed on each section of road each day, and tried to make my accelerations and braking consistent between commutes. Because I commute before 6 AM, traffic rarely interfered with my ability to maintain a consistent pace.

The direction of my route is simply based on a straight line drawn between the start and end points of my commute. The angle of that line relative to true north was calculated, and compared to the average wind direction during the commute to determine the angle of incidence with which the wind struck the car. Wind speed and direction were gathered from weather stations reported on wunderground.com, and chosen for their proximity to my route and ability to reflect the conditions my car experiences.  Unfortunately, winds can change speed and direction over the course of a 40-minute drive, so without more sophisticated ways of recording and calculating based on those changes, my results will suffer some amount of error due to this variation in the wind. I'm sure that shows up as some of the scatter in the data, but I don't currently know how to estimate that effect.

The Average Relative Headwind Speed (ARHS) was calculated by representing the car's average speed and direction as one vector, and the wind's speed and direction as another vector. The vector resulting from adding the two is the ARHS. When both vectors are pointing the same direction, the magnitude of the resulting vector is simply the sum of the two. When my car is driving directly into the wind, the magnitude of the ARHS is the difference of the two. Any angular difference in the direction of my car and the wind requires some trigonometry to achieve the ARHS.

The polynomial trendline shown on the second chart above was calculated by Microsoft Excel, and I chose a second-order polynomial because I know the force of the wind on an object is directly related to the square of the speed of the wind. I think fuel economy is probably linearly related to that force, so approximating the relationship between fuel economy and relative wind speed as a second-order polynomial made sense to me. I've wondered about the effect of the outliers on this approximation, but I'll leave that analysis for another day.

Conclusion
The effect of wind speed on fuel economy is evident in the data. The scatter in the data is greater than I'd desire, but likely exists because (a) my analysis ignored a variable(s) that also has a strong effect on fuel economy, and/or (b) my assumptions and measurement methods are too general. I am pleasantly surprised that the data shows the basic shape of a second-order polynomial, even if the coefficient of determination is rather low.

The next time we visit the MPG topic, we'll look at the effect of water on the road, and possibly some conclusions based on multiple variables.

Related post:
Does Outside Air Temperature Affect MPG?